The math behind Reinforcement Learning (RL) post-training for Large Language Models is notoriously unforgiving. As frontier AI labs push the boundaries of reasoning and coding models using algorithms like GRPO, they routinely hit hard architectural and physical constraints. While much of the industry's focus remains on raw GPU count, the actual gatekeeper of experimental velocity is infrastructure efficiency.
As established in large-scale systems research including ByteDance’s HybridFlow architecture (powering veRL) and Alibaba’s RollMux, optimizing the ratio of generator (sampler) to trainer throughput is the single largest driver of RL Total Cost of Ownership (TCO). While these frameworks define the architecture, executing this at production scale is challenging. We foresee this trend early on and have been purposefully building llm-d to address efficiency bottlenecks in RL. llm-d is not a reactive patch, it is a mature, production tested engine that is being deployed across production RL workloads.
We have made targeted investments to expand llm-d into a comprehensive, composable RL infrastructure stack designed to meet researchers where they are i.e. whether they are using Slurm or Kubernetes based setups:
- Throughput-Driven Inference: The llm-d router maximises the RL rollout generation throughput, ensuring samplers can saturate the pipeline and prevent downstream optimization trainers from stalling.
- Agent Sandbox (Sister Project): Fast tool use and isolated code execution are vital for generating reward signals. Our Agent Sandbox provides the secure, sub-second execution environments necessary to scale verifiable rewards and agentic rollouts without bottlenecking the GPUs.
- Core Pipeline Primitives: To combat generation stragglers, we shipped asynchronous batching and native inference schedulers, specifically designed to orchestrate complex, multi-turn RL workloads.
Today, we are introducing a new well-lit path in the llm-d project for Co-operative Time-Slicing : Snapshot Agent. Time-Slicing effort enables job interleaving into the Kubernetes platform layer to address the single greatest source of waste in modern RL: the Idle Accelerators. Snapshot agent is the first component that we are launching, other components will soon follow.
The following two sections in the blog provide a high level overview of problems in running RL workloads on scale followed by a brief overview of investments for solving those problems and then we dive deeper into the time-slicing for RL.
Core Challenges in Enterprise RL Infrastructure
Deploying large-scale RL infrastructure presents operational friction and cost inefficiencies. Main inefficiency among these is low hardware utilization; because typical RL training loops suffer from alternating blocking phases leading to an average GPU/TPU duty cycle of only around 40%. This structural waste is exacerbated during the sampling step, where generation stragglers create significant tail latencies and drag down overall sampling efficiency.
Furthermore, scaling distributed RL remains an engineering bottleneck. Teams face difficulties in configuring network primitives like NCCL and Intra-Cluster Interconnect (ICI), while simultaneously battling slow checkpointing operations and high-latency weight transfers across decoupled pools.
Finally, as organizations pivot toward Agentic RL use cases, they need isolation for untrusted code execution and tool calling during generation and reward evaluation steps during RL, all while struggling with reliability when running RL in distributed environments at scale.
The Solution : A composable RL Infrastructure Stack
To resolve these bottlenecks, llm-d have been investing in improving the efficiency, security, and observability for RL workloads. The solutions are composable meaning you can adopt one or more depending on your use case.
Efficiency:
- Co-operative Time-Slicing (repo, well-lit path) : We are introducing platform-level GPU and TPU time-slicing to multiplex concurrent RL jobs onto shared physical hardware, driving accelerator duty cycles from the poor 40% baseline up to a saturated 95%+ efficiency.
- RL scheduler (repo) : To eliminate tail latency, the platform implements intelligent routing and batching mechanics for the sampling step, boosting overall throughput up to 20% samples per second per accelerator.
- Weight Propagation interface (repo) : Weight transfer between sampling and training is streamlined via built-in Kubernetes controllers that automate NCCL,NIXL and ICI topologies, providing a faster and kubernetes native weight-transfer interface.
Security & Observability
- Sandboxing: To mitigate the risks of Agentic flows with RL, tool calling and dynamic code execution are isolated with Agent Sandboxes.
- Telemetry: Wrap these capabilities with a managed RL monitoring dashboard—delivering out-of-the-box golden telemetry, metrics, and distributed traces—and enterprises gain instant, actionable visibility to seamlessly troubleshoot and scale their most demanding RL pipelines.
The Core Efficiency Problem with RL Loops
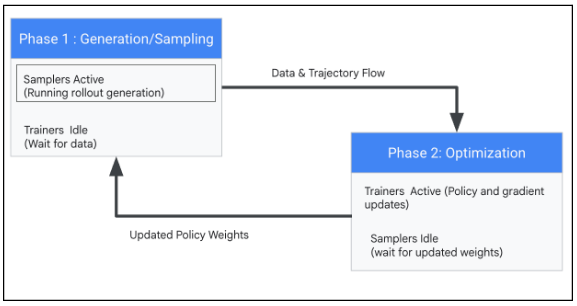
Distributed RL post-training, is a highly fragmented "stop-and-wait" loop. The pipeline operates as a continuous cycle between Generation and Optimization. While generation is running optimization accelerators are idle and vice-versa.
Traditional cloud infrastructure is designed for continuous, steady-state workloads. This alternating architecture introduces a structural inefficiency on standard Kubernetes clusters:
This structural cadence introduces two massive systemic inefficiencies at scale:
- The Idle Accelerators: Because these phases occur sequentially, expensive GPU and TPU clusters sit completely idle (0% utilization) for 40% to 60% of their lifecycle. Trainers sit idle waiting for sampling rollouts to finish; samplers sit idle during gradient updates and weights distribution. This "deadtime" could represent millions in wasted capital annually.
- The Context is Locked-In: RL training and samplers hold their accelerator allocations for the entirety of their runtime even during idle phases because the CUDA context and all device memory remains resident. Standard schedulers treat these pods as static, siloed allocations, completely rather than aligning to the alternating, phase-level states of the live RL loop.
Introducing Co-operative Time-Slicing (RL Job interleaving)
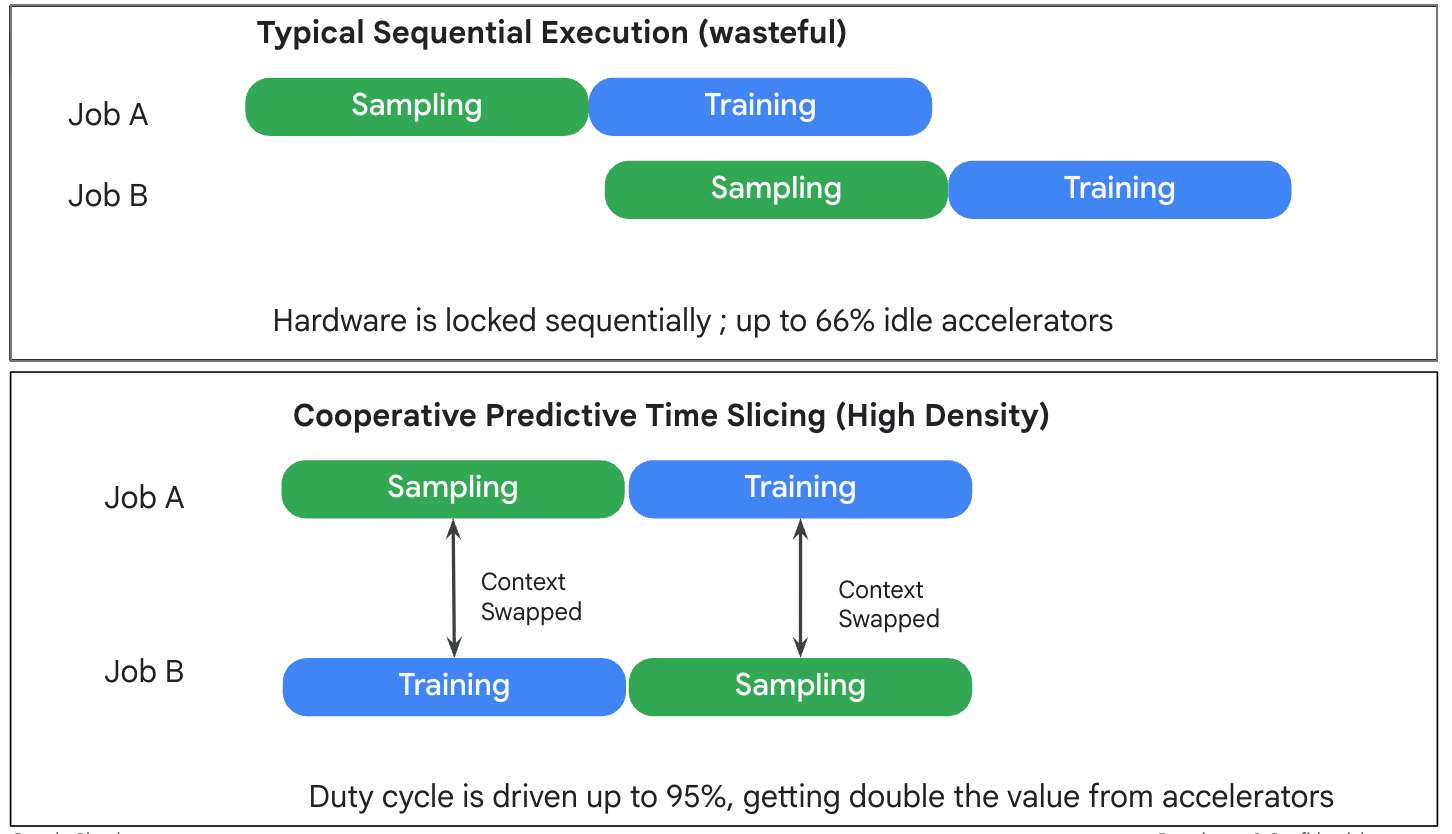
To eliminate idle accelerators during RL jobs, we are introducing Co-operative Time-Slicing under the llm-d project. Rather than forcing hardware to wait on upstream phases, the infrastructure dynamically interleaves independent RL jobs onto shared hardware blocks, driving aggregate accelerator duty cycles up to 95% without altering the underlying model convergence or accuracy.
When Job A pauses its training phase to run rewards evaluation on the CPU or distribute updated weights, the infrastructure time-slices the physical accelerators, swapping in the active sampling or training phase of Job B.
High Level Architecture Overview
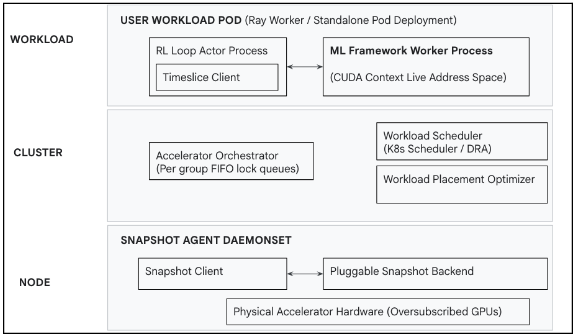
The Accelerator Time-Slicing Platform architecture is divided into three distinct operational boundaries—Workload-scoped, Cluster-scoped, and Node-scoped—to isolate developer code, cluster coordination, and physical hardware management. This layout maps how user-space runtime requests are translated into cluster-level lock queues and executed as node-level process context swaps.
1. Workload-Scoped Layer (Application Runtime)
This top layer encapsulates the containerized user training environment, such as a dedicated RayCluster or standalone Kubernetes pod configuration. It isolates the modeling code from infrastructure complexity:
- RL Loop Actor Process: The central coordinator of the training loop. RL code imports Timeslice Client library, which explicitly signals phase boundaries to the control plane using simple acquire() and yield() functions.
- ML Framework Worker Process: The background compute worker running the core training stack (e.g., PyTorch, vLLM). It maintains the live CUDA context, model weights, and allocations inside its virtual memory address space.
2. Cluster-Scoped Layer (Control & Orchestration Plane)
This middle layer governs cluster wide state, scheduling policies, and queue coordination across multi-tenant workloads:
- Workload Scheduler: A native Kubernetes scheduling infrastructure configured with Dynamic Resource Allocation (DRA). It uses custom DeviceClass parameters to enforce device oversubscription, instructing the cluster that it is safe to co-schedule multiple trainer/sampler pods onto the same physical hardware footprint.
- Accelerator Orchestrator: The central brain of the platform. It dynamically discovers group topology based on user-defined labels. It maintains FIFO lock queues per group to coordinate access to the accelerator and fans out atomic snapshot or restore commands to the Snapshot Agent on the target nodes.
- Workload Placement Optimizer: A future component that runs alongside the orchestrator. It automatically profiles workload execution patterns and configures time-sliceable job groups dynamically without manual user labeling.
3. Node-Scoped Layer (Hardware & Data Plane Isolation)
This bottom layer acts on the physical node boundary to enforce absolute memory isolation between oversubscribed pods:
- Snapshot Agent DaemonSet: A privileged daemon running on every accelerator node, exposing a gRPC interface that handles snapshot and restore calls from the Orchestrator or directly from an RL service. It performs the accelerator state save and restore.
- Pluggable Save Backend: A modular interface that translates agent commands into host process manipulation. The v1 implementation uses a cuda-checkpoint binary and NVML cgroup tracking to discover compute processes, freeze execution, and serialize the entire active CUDA context directly to host DRAM.
- Physical Accelerator Hardware Pool: The underlying physical GPU/TPU cluster infrastructure where oversubscribed execution steps alternate seamlessly without OOM risks or framework-level interference.
End-to-End Control and Data Flow for Time-Slicing
- The user's RL training loop reaches a natural pause point—such as the end of a rollout generation phase or a training step, a logical boundary where it is safe to give up the physical accelerator. At this boundary, the job invokes the TimeSlice client library to request hardware access for its next operational phase.
- The client library dispatches an Acquire RPC to the Accelerator Orchestrator, explicitly identifying the active job_id and the targeted group of hardware nodes it requires. This remote procedure call synchronously blocks, forcing the workload thread to wait until the platform layer determines it is safe to proceed.
- If another independent RL job currently holds the execution lock on the designated accelerator pool, the Accelerator Orchestrator places the incoming request into a First-In, First-Out (FIFO) queue assigned to that node group, preserving the strict order of request arrival.
- When the active job finishes and yields control, the orchestrator begins a coordinated swap. It communicates with the node-local Snapshot Agent to trigger a memory snapshot of the yielding job's active accelerator state, serializing its entire live CUDA context and moving the data off the physical accelerator into host DRAM.
- With the physical accelerator hardware now successfully evacuated and free of memory residency, the orchestrator evaluates the queue state, pops the next pending job from the front of the FIFO line, and initiates the control transfer.
- The orchestrator coordinates with the destination node's Snapshot Agent a second time, executing a restore operation. The agent deserializes the incoming job's cached state, lifting its model weights and execution context out of host DRAM and streaming them back onto the accelerator's high-bandwidth memory (VRAM).
- Once the physical memory restore completes successfully, the orchestrator grants the execution lock to the new job and returns a success status to the blocked Acquire call. The worker process immediately unblocks and resumes execution exactly where it left off, requiring zero rewrites or modifications to its core modeling logic.
- The job that previously yielded its compute window now sits warm in host memory. Its process state remains active, completely bypassing container cold-start overhead and standing ready to be re-streamed onto the accelerators just as efficiently when its turn comes back around in the scheduling queue.
Early Benchmarks
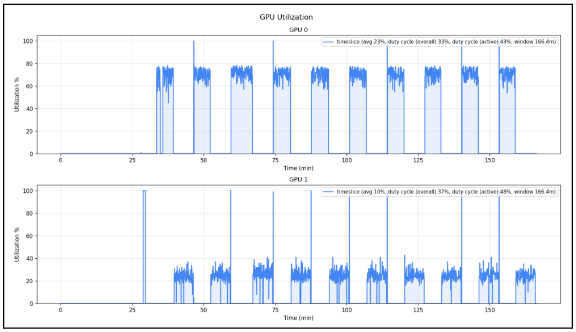
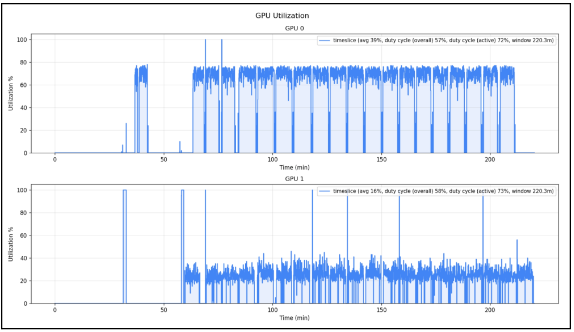
To validate the infrastructure’s ability to reclaim stranded compute capacity without impacting algorithmic convergence, early tests evaluated the platform-native time-slicing system using a representative Reinforcement Learning (RL) workload featuring veRL/GRPO, PyTorch FSDP trainers, and vLLM samplers on NVIDIA H100 GPUs
During the test, interleaving two independent sampler workloads on a single node elevated the actual hardware duty cycle from a baseline of 41% to 71%, with a theoretical peak of ~95% under idealized phase alignments. Because the active job has exclusive access to the GPU during its compute window, there is zero degradation to token generation or training step throughput.
Simple Developer Experience (client-side)
We believe researchers should focus on core modeling logic rather than wrestling with low-level CUDA context switching or custom scheduling loops. With llm-d, you can enable RL job multiplexing by wrapping the accelerator phases in your existing loops with a simple Python decorator:
from timeslice import OrchestratorClient
orchestrator = OrchestratorClient(job_id="job-1")
@orchestrator.on_accelerators(group_id="trainer-group")
def train_phase(model, trajectories):
return model.update(trajectories)
@orchestrator.on_accelerators(group_id="sampler-group")
def generate_phase(model, prompts):
return model.generate(prompts)
for epoch in range(EPOCHS):
trajectories = generate_phase(policy, dataset)
rewards = compute_rewards(trajectories)
train_phase(policy, rewards)
Current Release and Future Outlook
Today we are releasing the Snapshot Agent along with a well-lit path for integrating it into managed multi-tenant RL services to support full fine-tuning.
Here's what comes next.
Expanding the Snapshot Agent: We will add backends that enable ultra-fast snapshots and selective snapshot support that checkpoints only specific memory regions such as LoRA adapter weights. Together, these unlock faster context switches for full fine-tuning workloads and open up new use cases such as multi-tenant RL services that time-slice between tenants by swapping only the adapter state.
Accelerator Orchestrator and Timeslice Client: The Orchestrator coordinates time-slicing across multiple jobs managing cooperative lock queues and driving context switches at phase boundaries. Alongside it, we will ship a lightweight client library that any RL application can integrate with using a two-call API: acquire() before the accelerator phase and yield() after.
Framework integrations: We will provide well-lit paths for integrating with slime, veRL, and other popular RL training frameworks making it easy for researchers to adopt time-slicing without leaving their existing training stack.
Simplified onboarding and intelligent job placement: We will simplify platform deployment and, looking further ahead, build a component that automatically identifies time-sliceable workloads and makes intelligent job placement decisions eliminating the need for users to manually identify and group compatible workloads.
Expanding accelerator support: In line with llm-d's hardware-agnostic mission, we are designing the platform to span multiple accelerator architectures starting with GPU and expanding to TPU and beyond.
Help Shape the Future of SIG-RL
Building robust, highly optimized RL infrastructure requires tight collaboration with the engineers and researchers running these workloads at scale.
If you are currently wrestling with low GPU utilization, synchronization stalls, or complex scheduling logic in your post-training pipelines, we want your feedback: